In the midst of my research phase, I received a link to an email that was relevant to my project. As I delved deeper, I learned that the City of Newton and the Safe Routes to School Task Force had created a survey to collect data on how children get to and from school and why these choices are made. Their purpose in collecting the information was to to identify issues and hopefully provide more options for parents and students. Over the past few years, a growing number of children have been arriving and leaving school by individual car. As a result of the increased amount of cars, traffic has become more intense, causing issues that ripple throughout the city. What begins at the schools, creates heavy traffic on feeder roads, neighborhood complaints, etc. Theoretically, these problems could be easily fixed by reducing the number of students arriving in individual cars.
I connected with one of the leaders of the project, Alicia Bowman and she was more than happy to collaborate with me. The data included 471 response from Newton North High School families. Of these points, only about 450 included the necessary information. Parents provided a response on how their children travel to school 5 times a week. These answers included walking, biking/scootering, taking the school bus, taking the MBTA bus, driving with family, driving themselves, driving with other students, and carpooling. I stratified the methods into three different groups: Non CO2 producing method which included walking, biking, and scootering, Alternative CO2 Method: riding the buses, and CO2 Method: driving a car. The survey also included an approximate starting location by asking for the nearest intersection for example Commonwealth Avenue / Temple Street.
I connected with one of the leaders of the project, Alicia Bowman and she was more than happy to collaborate with me. The data included 471 response from Newton North High School families. Of these points, only about 450 included the necessary information. Parents provided a response on how their children travel to school 5 times a week. These answers included walking, biking/scootering, taking the school bus, taking the MBTA bus, driving with family, driving themselves, driving with other students, and carpooling. I stratified the methods into three different groups: Non CO2 producing method which included walking, biking, and scootering, Alternative CO2 Method: riding the buses, and CO2 Method: driving a car. The survey also included an approximate starting location by asking for the nearest intersection for example Commonwealth Avenue / Temple Street.
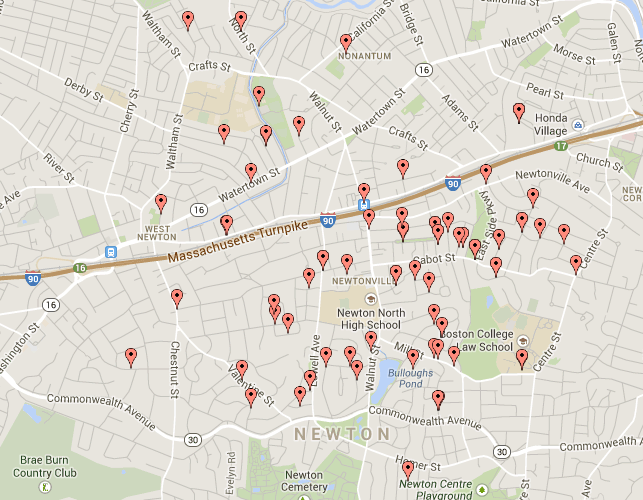
Map Distributions:
Here are a map layout of the the spread of student transit methods.
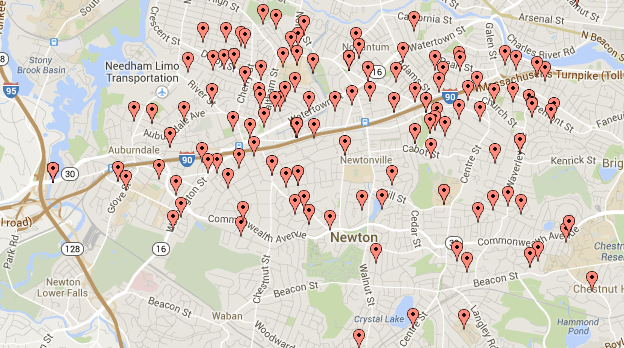
Walking and Biking distribution:
The students whom walk to school tend to live within a 0-1 mile radius. Typically, the average walker is around .5 miles. The walking limit approaches 1.5 miles maximum.
Single Car Mileage Distribution:
Car Pool Mileage Distribution:
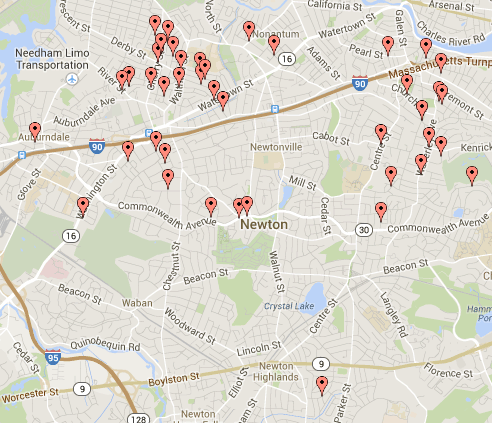
For students that drive cars to school, the range is quite broad, around .8-3 miles. The majority of carpoolers are outside of the 1 mile range. This suggests that if families carpool, they generally won’t drive close to the school. However, amongst the single car rides, there are a minority of drivers that commute under 1 mile. These are the potential walkers and bikers that are instead producing CO2.
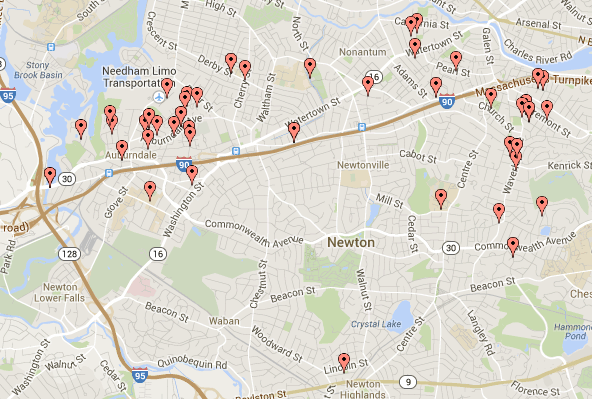
Bus Mileage Distribution
The Bus users are generally much farther away. Usually this is because one must qualify for ridership. One goal would be to increase ridership in order to reduce CO2 production per user.
Assumptions:
My calculations have included a variety of assumptions that should be taken into account while observing the final number. To begin, we are assuming that the proportions of each category in the survey ex) driving with family, is an accurate representation of the overall school population. For instance, the proportion of family drivers in the survey is 100/450 = .22 and therefore the school’s proportion of family drivers is .22. While this may be true, there is no simple way to accurately compare the two.
Another instance of variability adjusted in the data sets is the amount of days a student gets to and from school. In the survey, students had the opportunity to detail the day by day way they get to school. For example, they could walk twice a week and drive three times a week. To simplify the calculations, I grouped the data by the majority of the way they got to school. The student mentioned above would be an assumed 5 day a week driver. Furthermore, the answers to these questions are not 100% accurate. I am sure there is not one student who has driven every day of the year, 5 days a week. In some extremes they must either walk, bike, or carpool. My calculations have not taken into account the possibility of multiple methods of transportation per student.
Lastly, due to distance being an important factor in calculating CO2 production, I was required to make some assumptions on mileage. The data provided consisted for a nearest intersection to the student’s house. To begin, this already produces a potentially missed amount of mileage. The closest intersection could be .1-.2 miles away from one’s house. Furthermore, my particular method for calculating the distance of each data point was not completely accurate. I used Google maps and found each intersection on the map. Then, I used the directions options and calculated the distance to Newton North. Each time, I choose the first route which may not be the particular way each driver actually goes to school. However, my method provides a relatively accurate representation on each categories distribution of mileage.
Another variable we must take into account is the type of car. Every model has a slightly different MPG and CO2 production rate. In order to determine which car is used in Newton, I am going to utilize the EPA estimate for the “Average Car” which is 422 grams CO2/ per mile (EPA). I had planned to utilize data from the Assessors Office of Newton, however they could not provide me with enough data to make the calculation possible. Furthermore, the average CO2 gram / mile of a school bus is approximately 89.20. (EPA)
Checking the Data
Limitations of Data: Getting to School Data:
Independence: While N>10% of the total population, it will not affect the results because we are not taking multiple samples.
Random: The survey was given out to the entire school population. Of all the student families, only 450 replied. These can be considered random because there was no incentive or reason not to reply to the particular survey. For example, families that walked were not more inclined to reply than families that drive to school everyday.
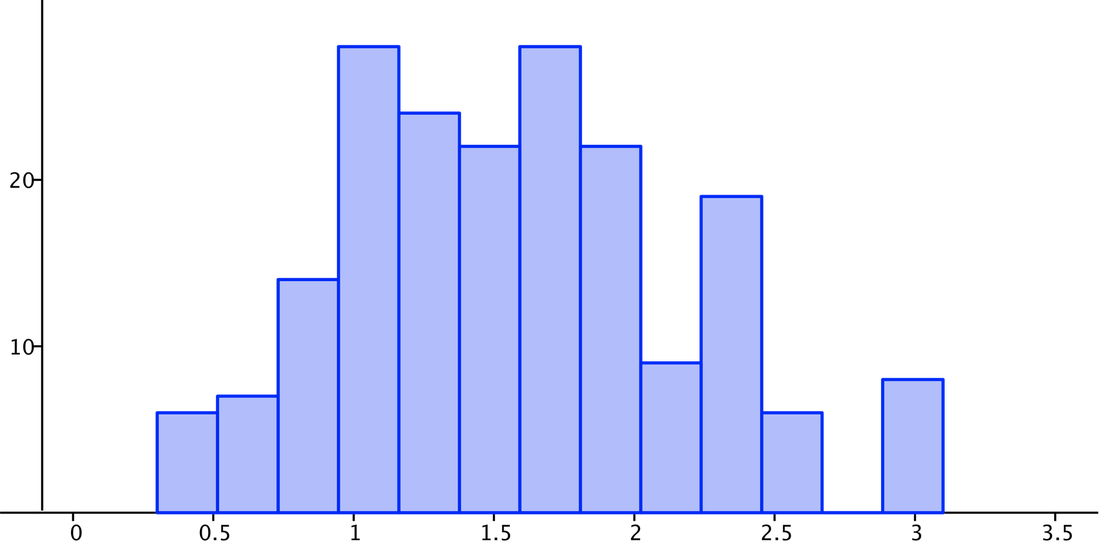
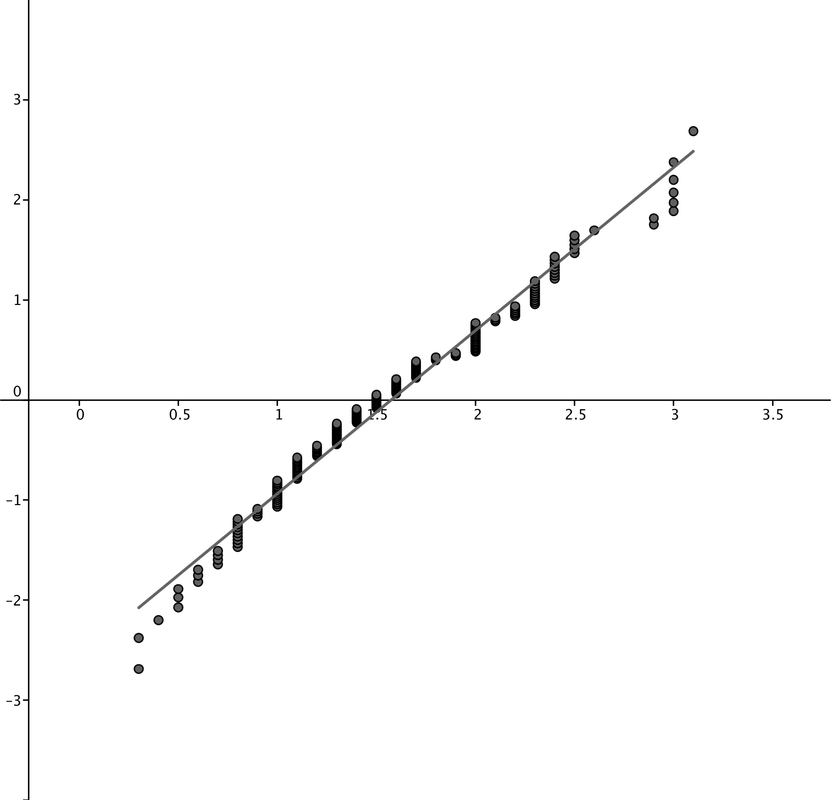
Normal: Each of the distribution of mileage graphs above reveal a relatively normal distribution. None of the data sets have any significant departure from normality. They do not contain any irregular outliers either. Therefore, we can conclude normality.
Independence: While N>10% of the total population, it will not affect the results because we are not taking multiple samples.
Random: The survey was given out to the entire school population. Of all the student families, only 450 replied. These can be considered random because there was no incentive or reason not to reply to the particular survey. For example, families that walked were not more inclined to reply than families that drive to school everyday.
Normal: Each of the distribution of mileage graphs above reveal a relatively normal distribution. None of the data sets have any significant departure from normality. They do not contain any irregular outliers either. Therefore, we can conclude normality.
Carpool Mileage Distance Distribution:


N= 49 Min= 0.8
Mean = 1.749 Q1= 1.4
σ= 0.5206 Median= 1.7
s= 0.526 Q3= 2
Σx= 85.7 Max= 3.1
Σx^2 = 163.17
Single Car Mileage
N= 193 Min= 0.3
Mean= 1.5741 Q1= 1.1
σ= 0.6116 Median= 1.5
s= 0.6132 Q3= 2
Σx = 303.8 Max= 3.1
Σx^2 = 550.4
Bus Mileage
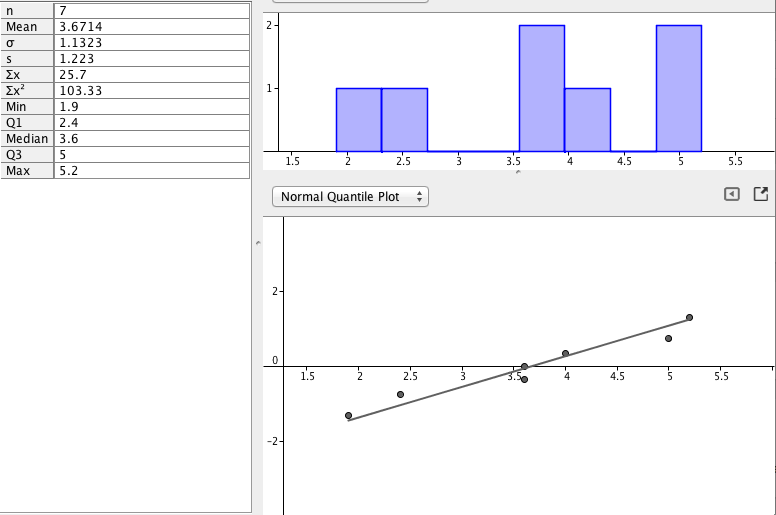
Note: Bus routes were based off the Newton bus schedule page . The school includes 7 bus’s that drop students off at school each morning. The bus mileage was calculated through google maps directions. Also, MBTA was not used in my calculation because the route would be taken everyday, regardless of student ridership.
Calculations
CO2 is a byproduct of the combustion of gasoline in a car. The distance a car has to travel determines the amount of CO2 produced. Walking, Biking, and scootering produce no CO2. However, riding any type of vehicle does. For my calculation I will analyze the CO2 of all cars and school buses.
The total school population typically consists of ~1800 students. We will use this as our general population.
Each category proportion :
Walk/Bike - .277
Bus - .184
Drive by Self - .438
Drive with Carpool - .108
For purpose of CO2 production, we will only look at Bus, Drive by Self, and Carpool. By multiplying by 1800, we find the typical student population of each category.
Bus - .184 *1800 = 331
Drive by Self - .438 *1800 = 788
Drive with Carpool - .108 *1800 = 194
Then, we will calculate the total Vehicle Mile Travel Per day for each amount of drivers. In order to do so, we must multiply the (total student population by category) * (mean miles traveled by category)
Bus - .184 *1800 = (331) → for buses, there are only 7 buses that travel at once. They travel a total of 25.7 miles a day. They do this 5 times a day, so we would multiply by 5 to find the weekly VMT. This will be their VMT. == 129 VMT
Drive by Self - .438 *1800 = (788) * (1.749) = 1378 VMT
Drive with Carpool - .108 *1800 = (194) * (1.5741) = 305 VMT
With the VMT of each category, we can multiply by the average amount of CO2 produced by each vehicle type.
Bus = (129 VMT) * (89.20g CO2/mile traveled) = 11,507g.
Drive by Self = (1378 VMT) * (422g CO2/mile traveled) = 581,516g
Drive with Carpool = (305 VMT )* (422g CO2/mile traveled) = 128,710g
If take the sum of these three categories, we attain the 1 week CO2 production.
(Bus = 11,507g) + (Drive by Self = 581,516g) + (Drive with Carpool = 128,710g)
=721,733g = 721.733 CO2 kg/week
With about 36 weeks of school, we can calculate the year total CO2 production:
721.733 CO2 kg/week * 36 Weeks = 25,982.388 = 26,000 kg CO2
To put things into perspective: a few items that would produce the same amount of CO2
Thats about 780 pairs of flips
Or 154 shoes
or 3700 six packs of beer
or 4063 hamburgers.
